
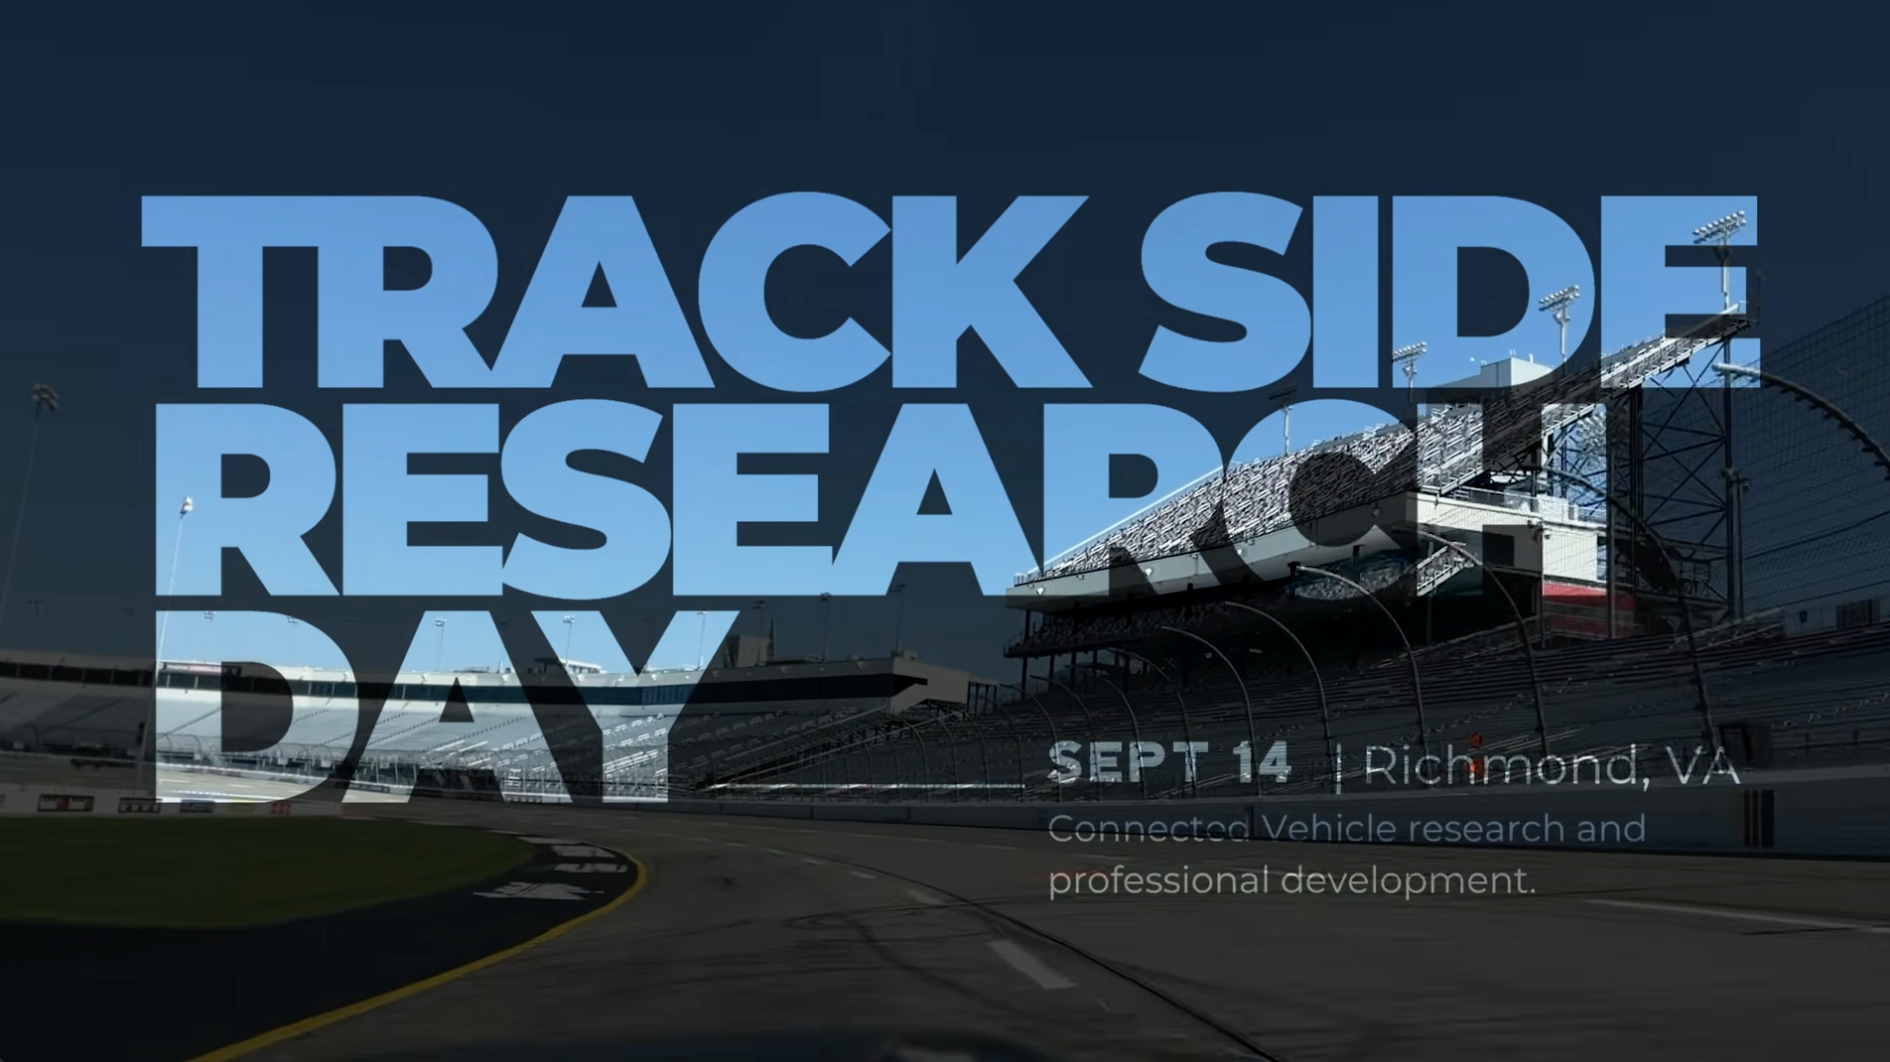
On September 14th 2026, Compass held our annual Track Side Research Day at Richmond Raceway in Virginia — our first in North America. Over 60 transport professionals from across the USA spent the day participating in real-life road safety experiments and listening to presentations on how Compass connected vehicle data is being applied across the country and abroad.
The event brought together transport leaders from organisations such as the Virginia Department of Transportation (VDOT), Federal Highway Administration (FHWA), Purdue University, GHD, VHB, City of Norfolk, City of Wilmington, Department of Justice, Kent County Council, and Virginia Tech Transportation Institute. Presenters included:
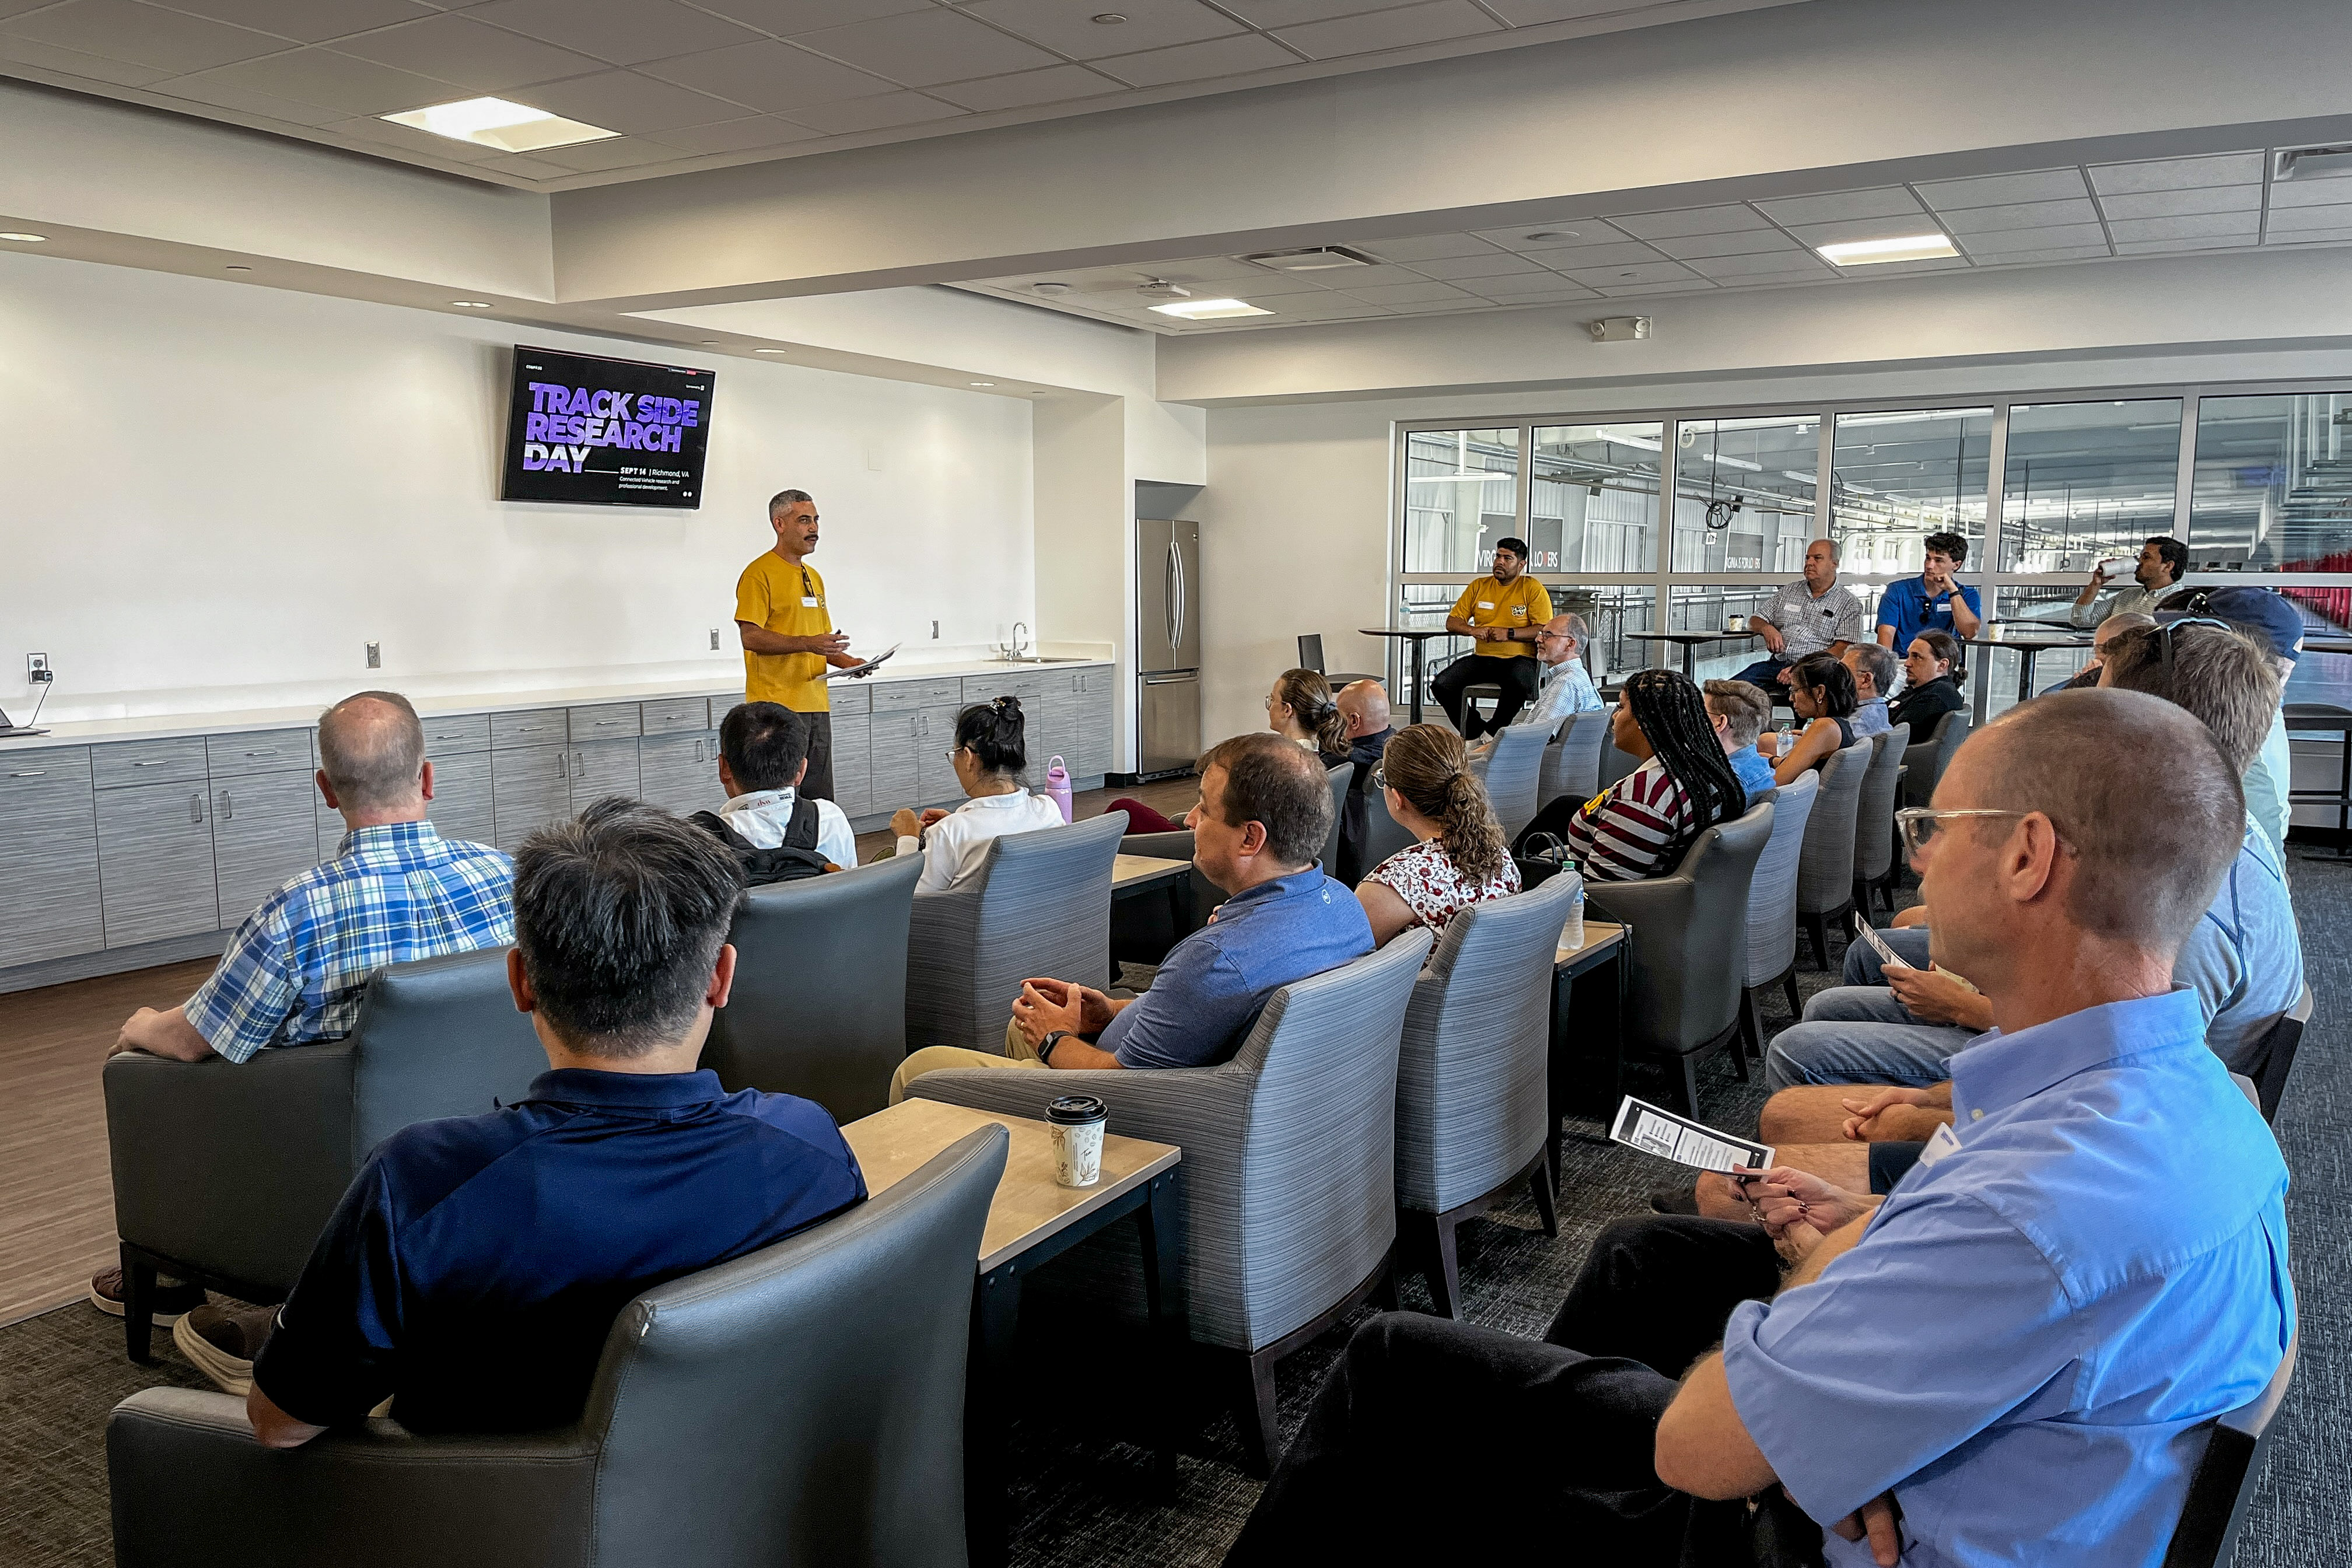
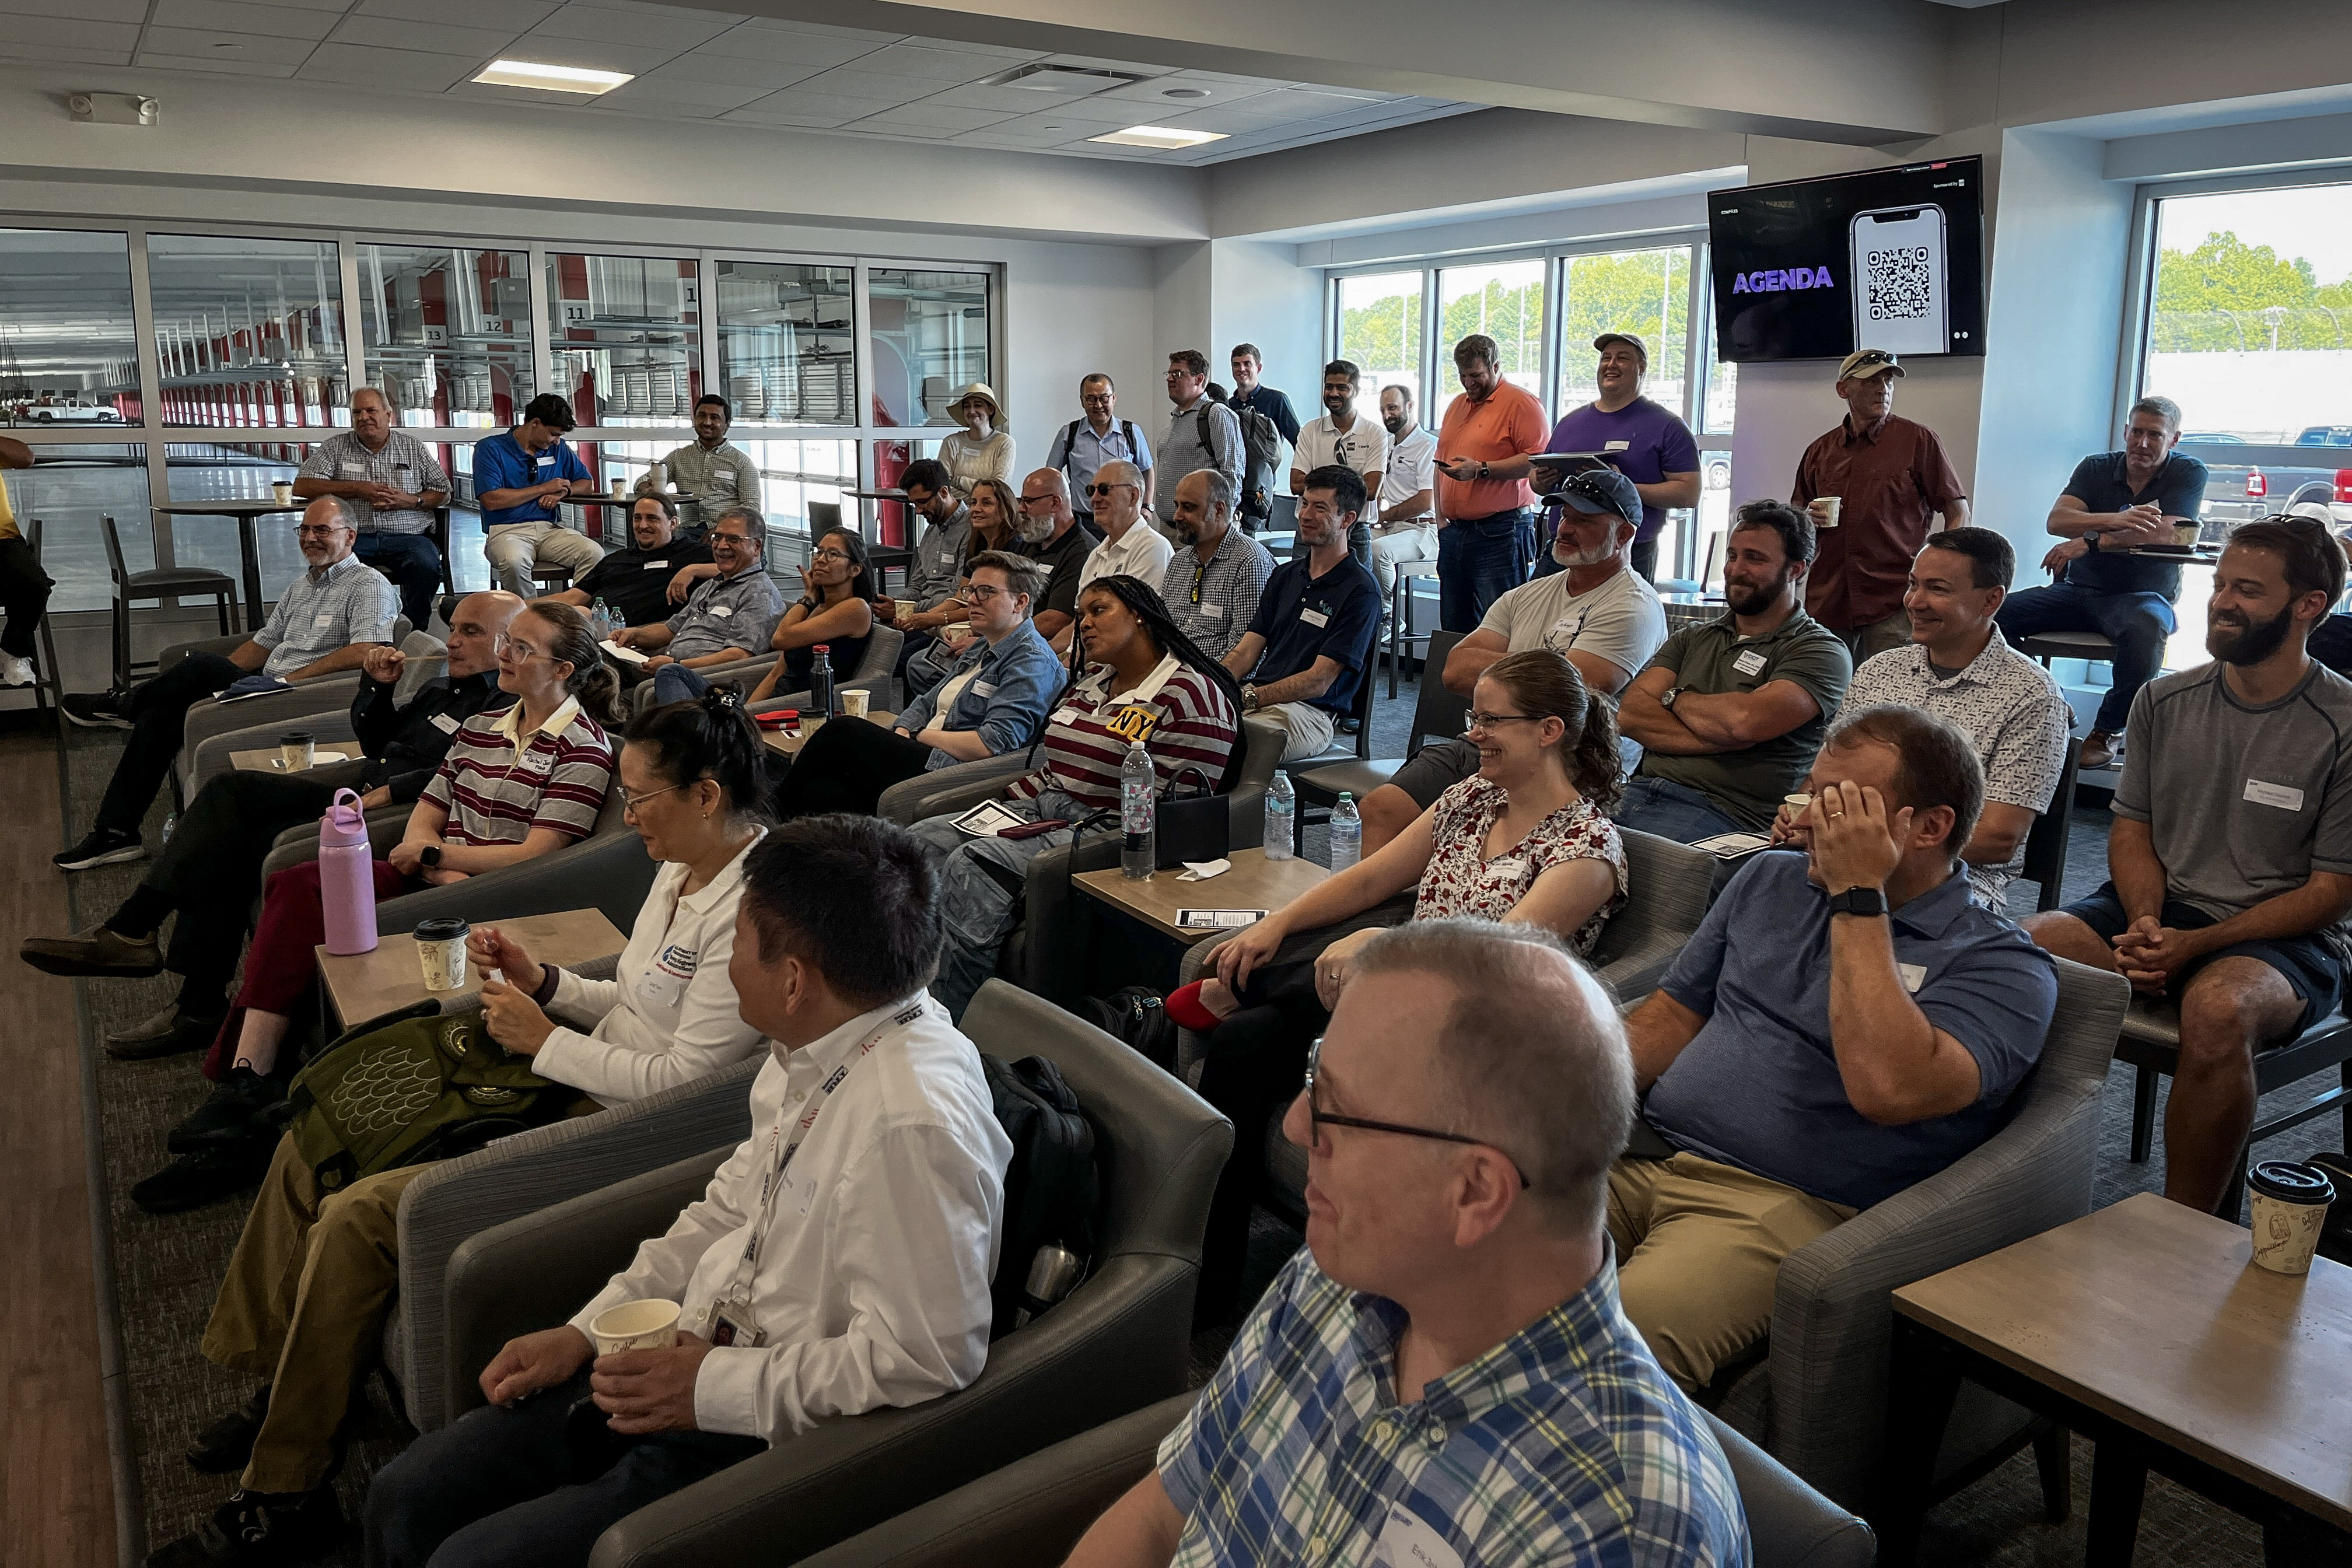
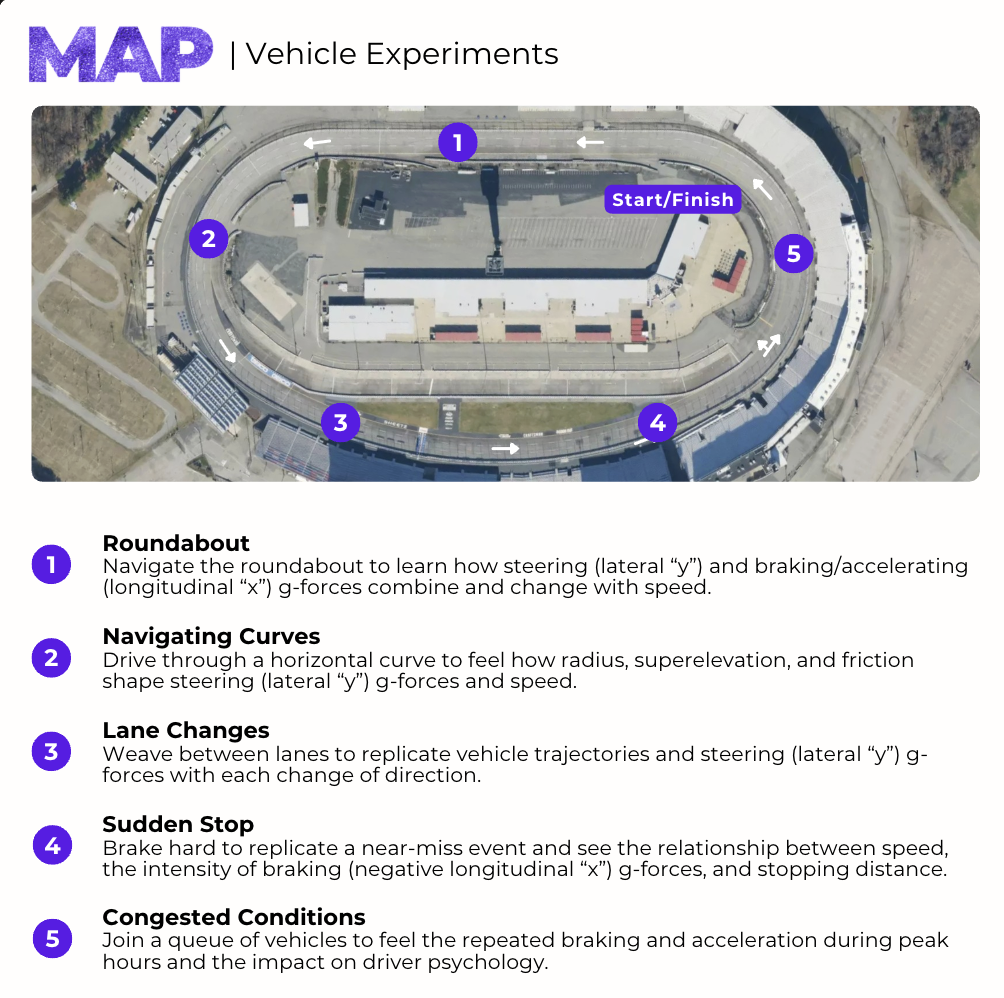
Attendees participated in 5 experiments that imitated sections of the road network under different speeding and braking conditions:
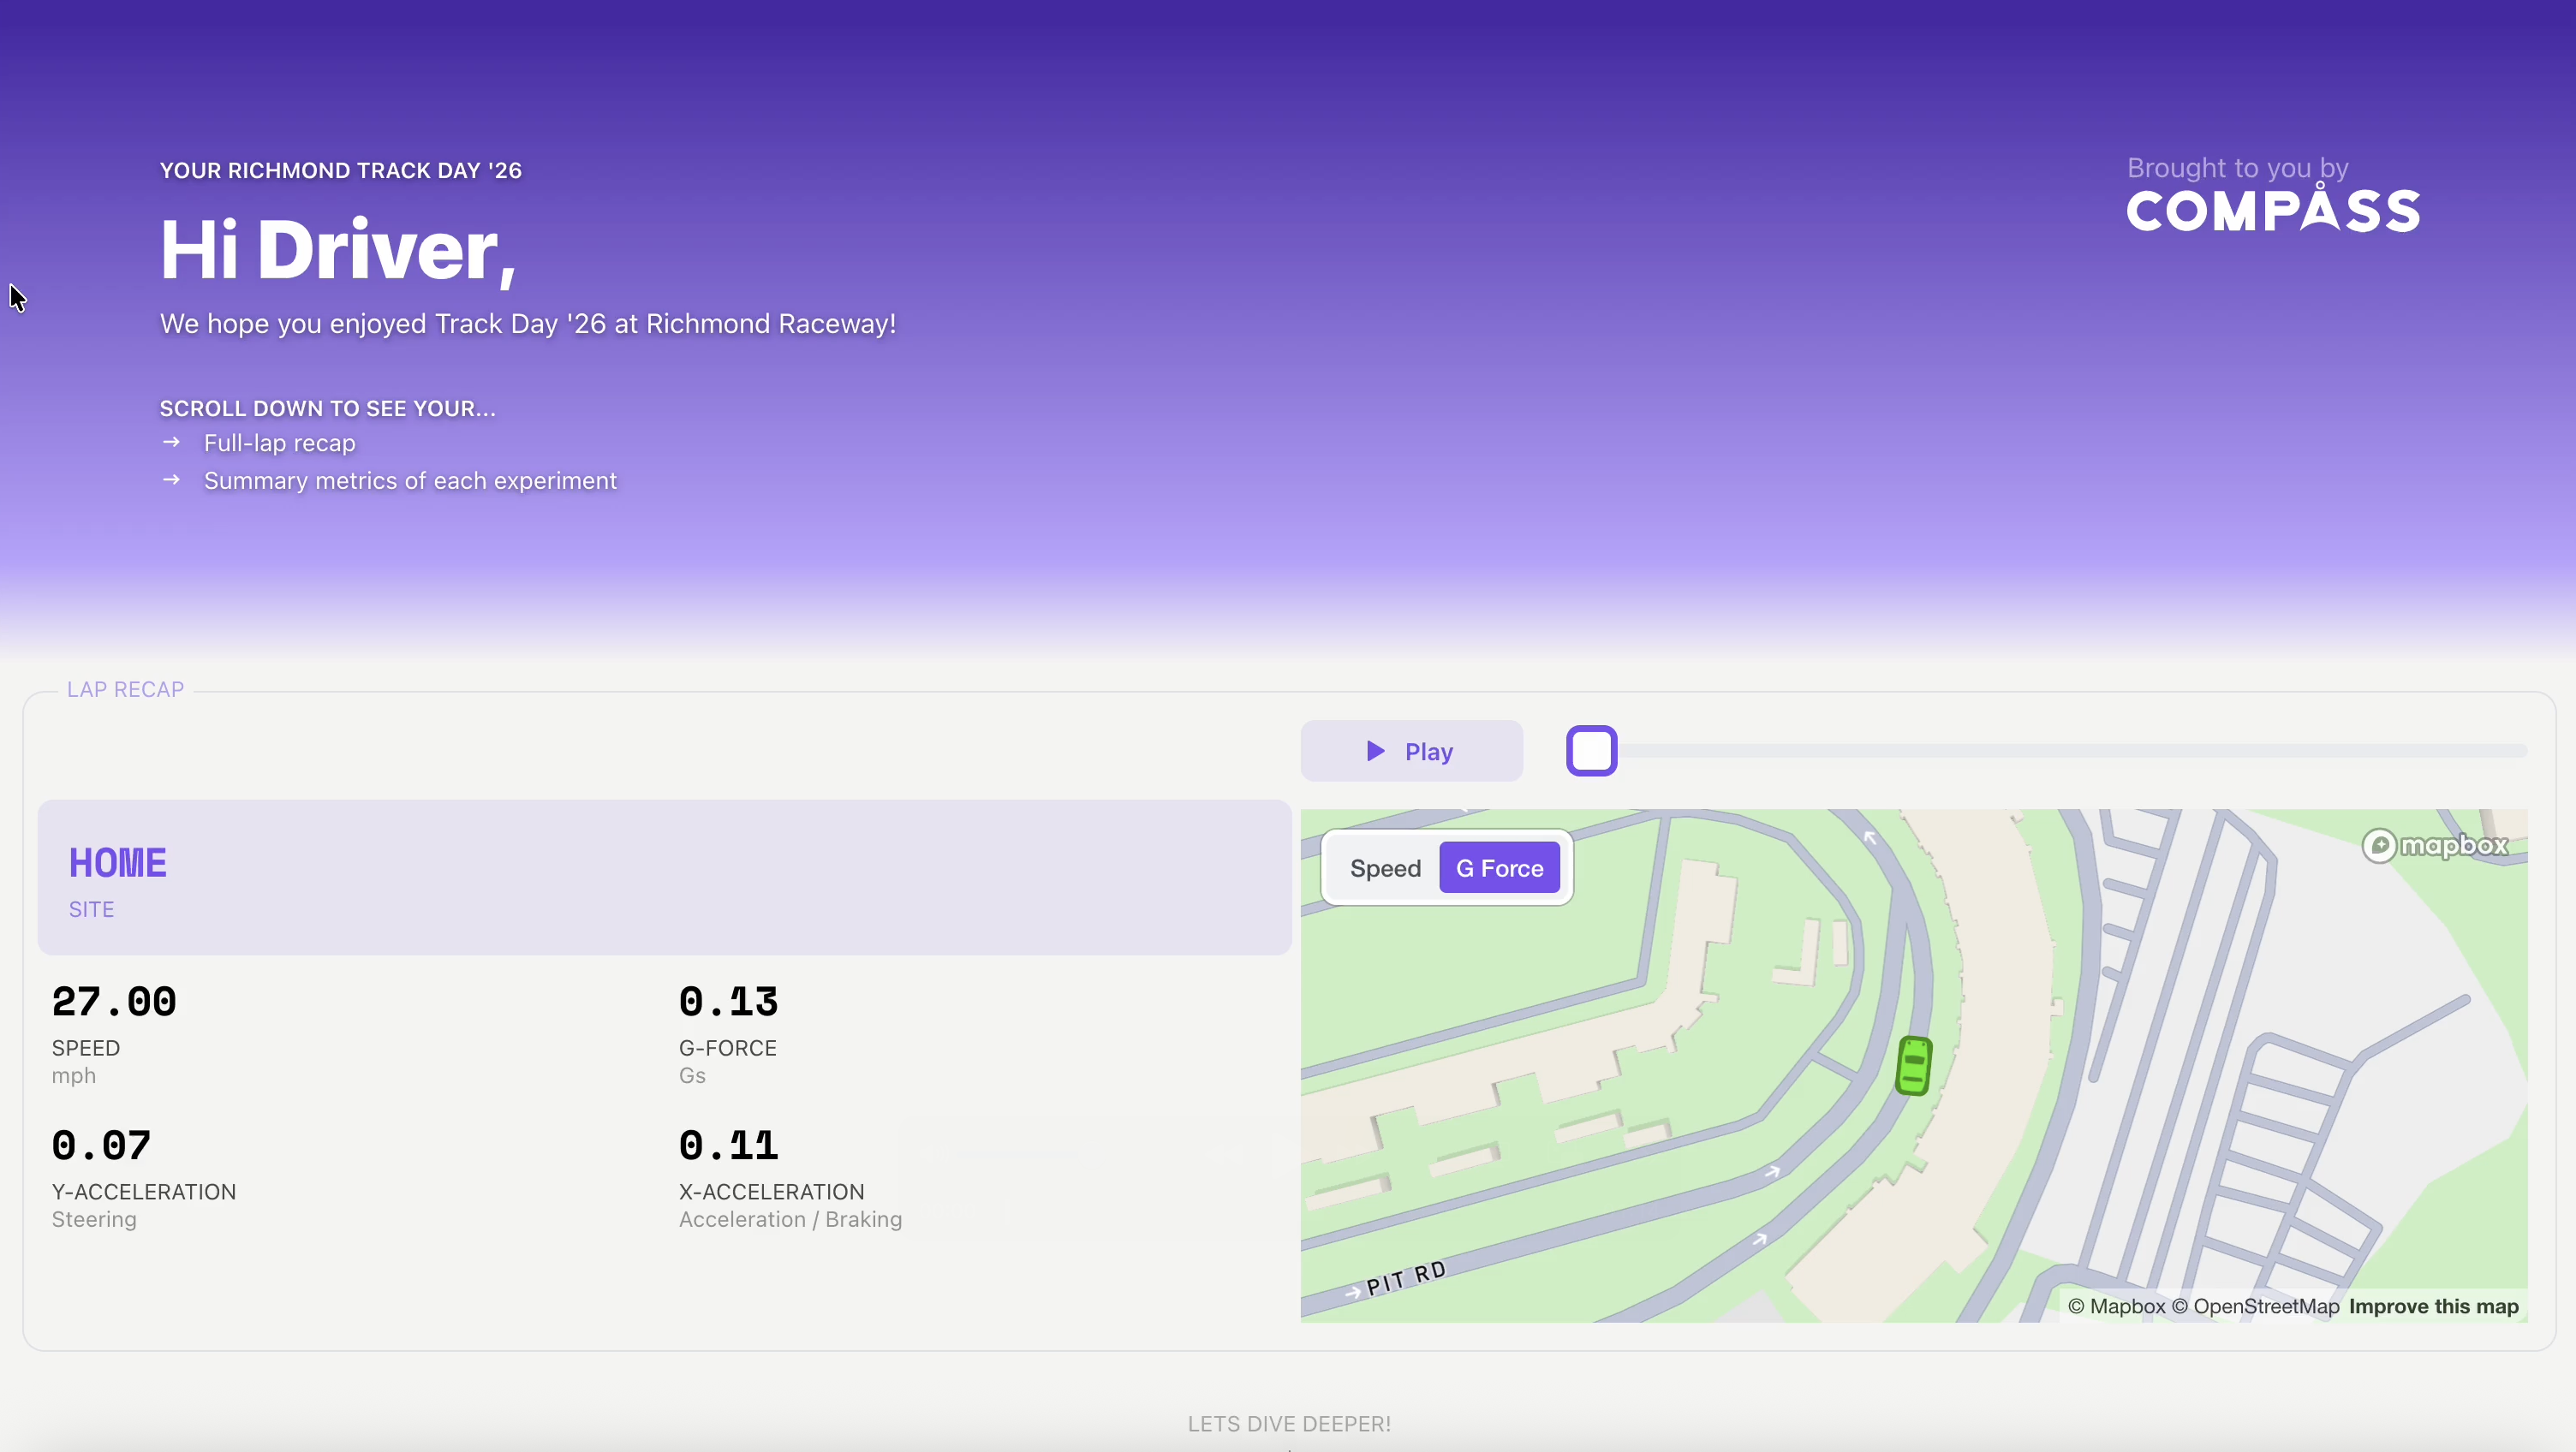
Participants received personalised results on their phone covering their overall trip and each experiment. An example of the kinds of data they received is below.
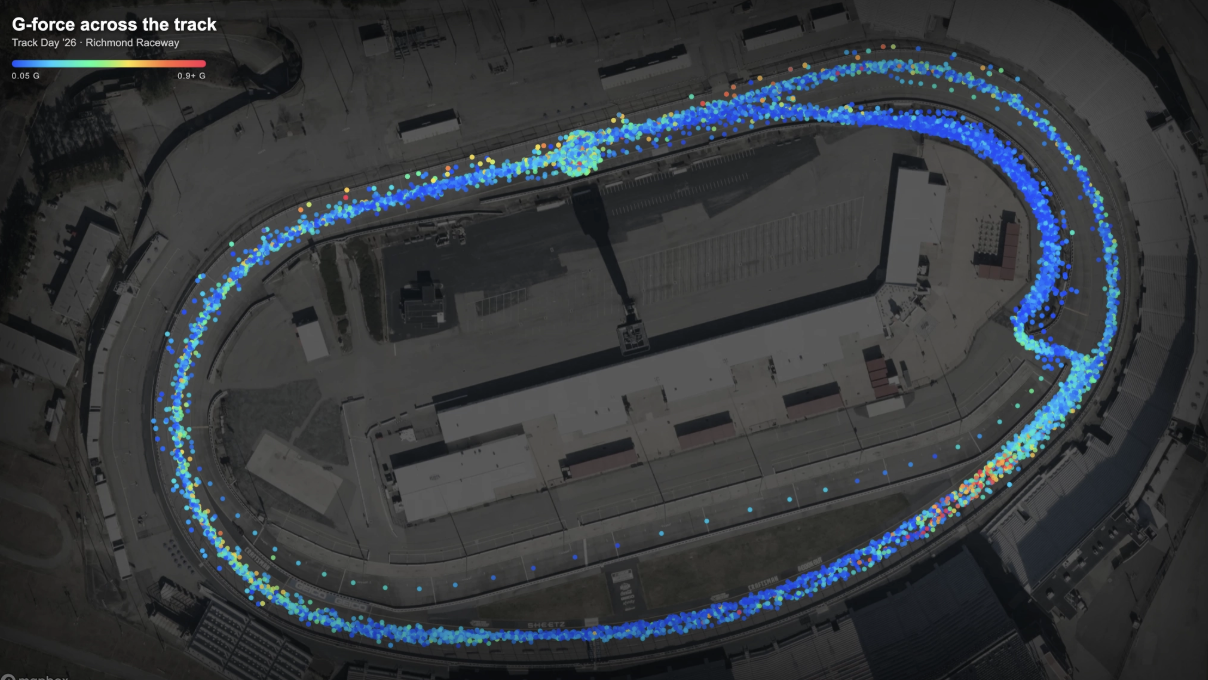
Below are the speed and g-force distribution graphs for each experiment site in mph. The highest speeds and g-forces were recorded at the Harsh Braking and Navigating Curves experiments.
One participant recorded a g-force of 1.22 at the Harsh Braking site. Noting that the accepted ‘safe’ threshold for g-forces in most on-road situations is 0.47, approximately 2.6 times the threshold. Another participant recorded a speed of 92.3mph at the Navigating Curves site.

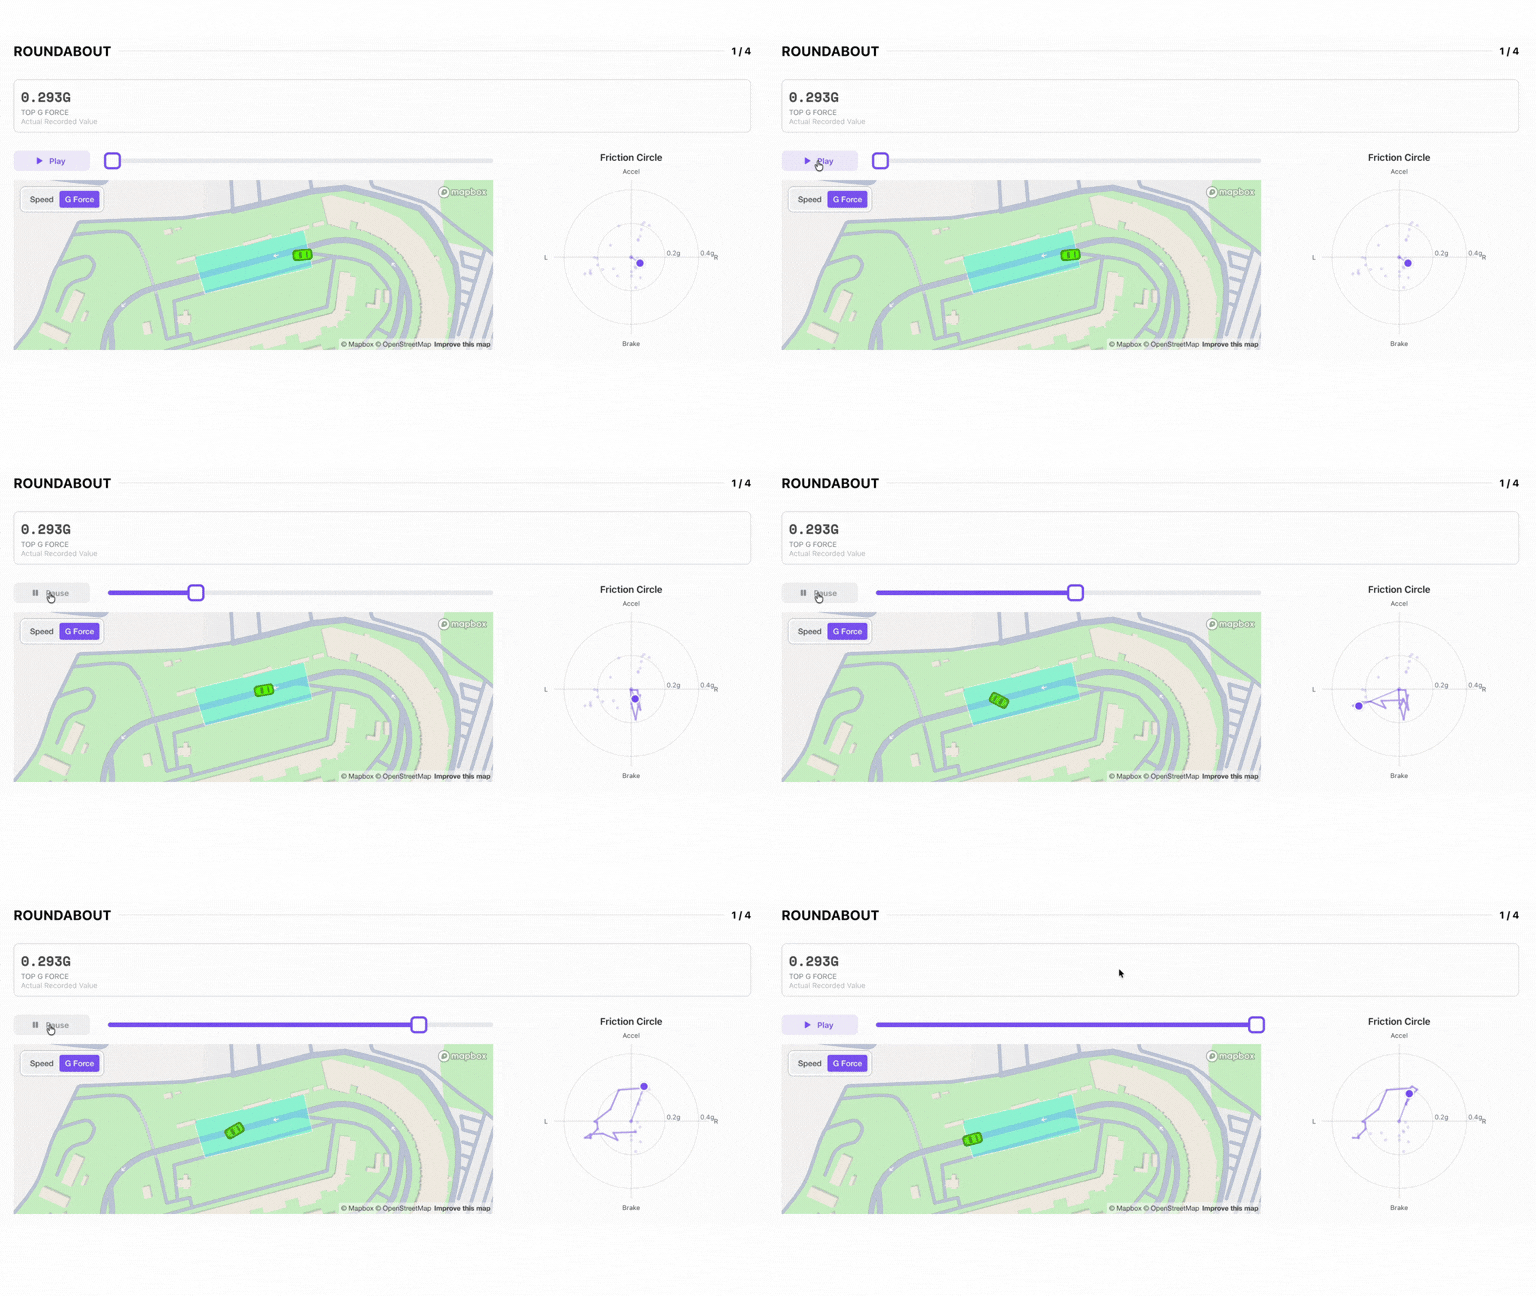
85% of drivers underestimated the intensity of their g-forces. As in previous years, we hypothesise that part of this is an education gap about what is considered a safe or unsafe g-force reading (i.e., above 0.47 or below -0.47) and contextualising g-force movements in real-life scenarios. Estimates generally improved for drivers who completed more than one round of experiments. Most drivers complied with the posted limits, with 57% driving under the 65mph speed limit.
The biggest underestimations of g-force occurred at the roundabout experiment, where 87% of participants estimated a lower reading than the data recorded.
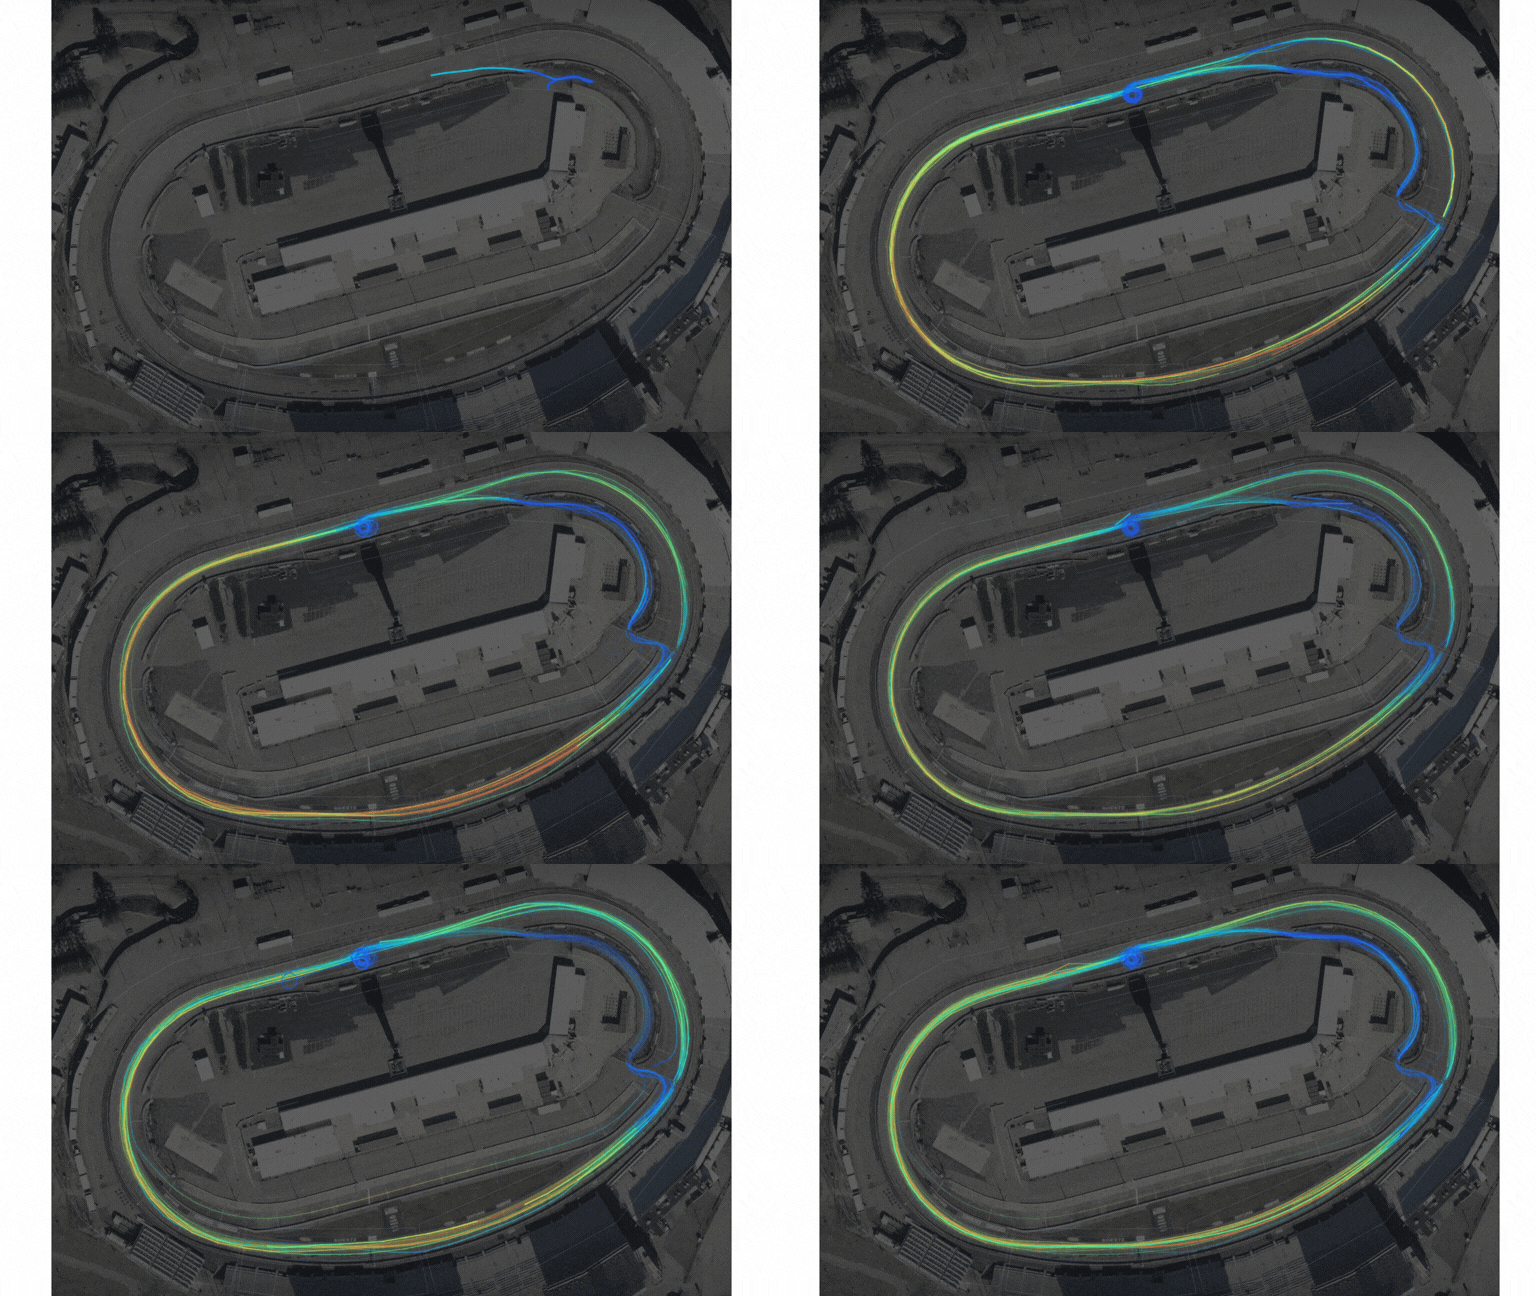
All vehicles used on the track were natively connected — the data was streamed directly from the vehicles, without any phones or onboard devices. Below is the trip traces collected from vehicles as they went around the track.
If you found this article interesting, you might want to check these ones out.

.png)
If you found this post interesting, you might also want to check out these.
.png)