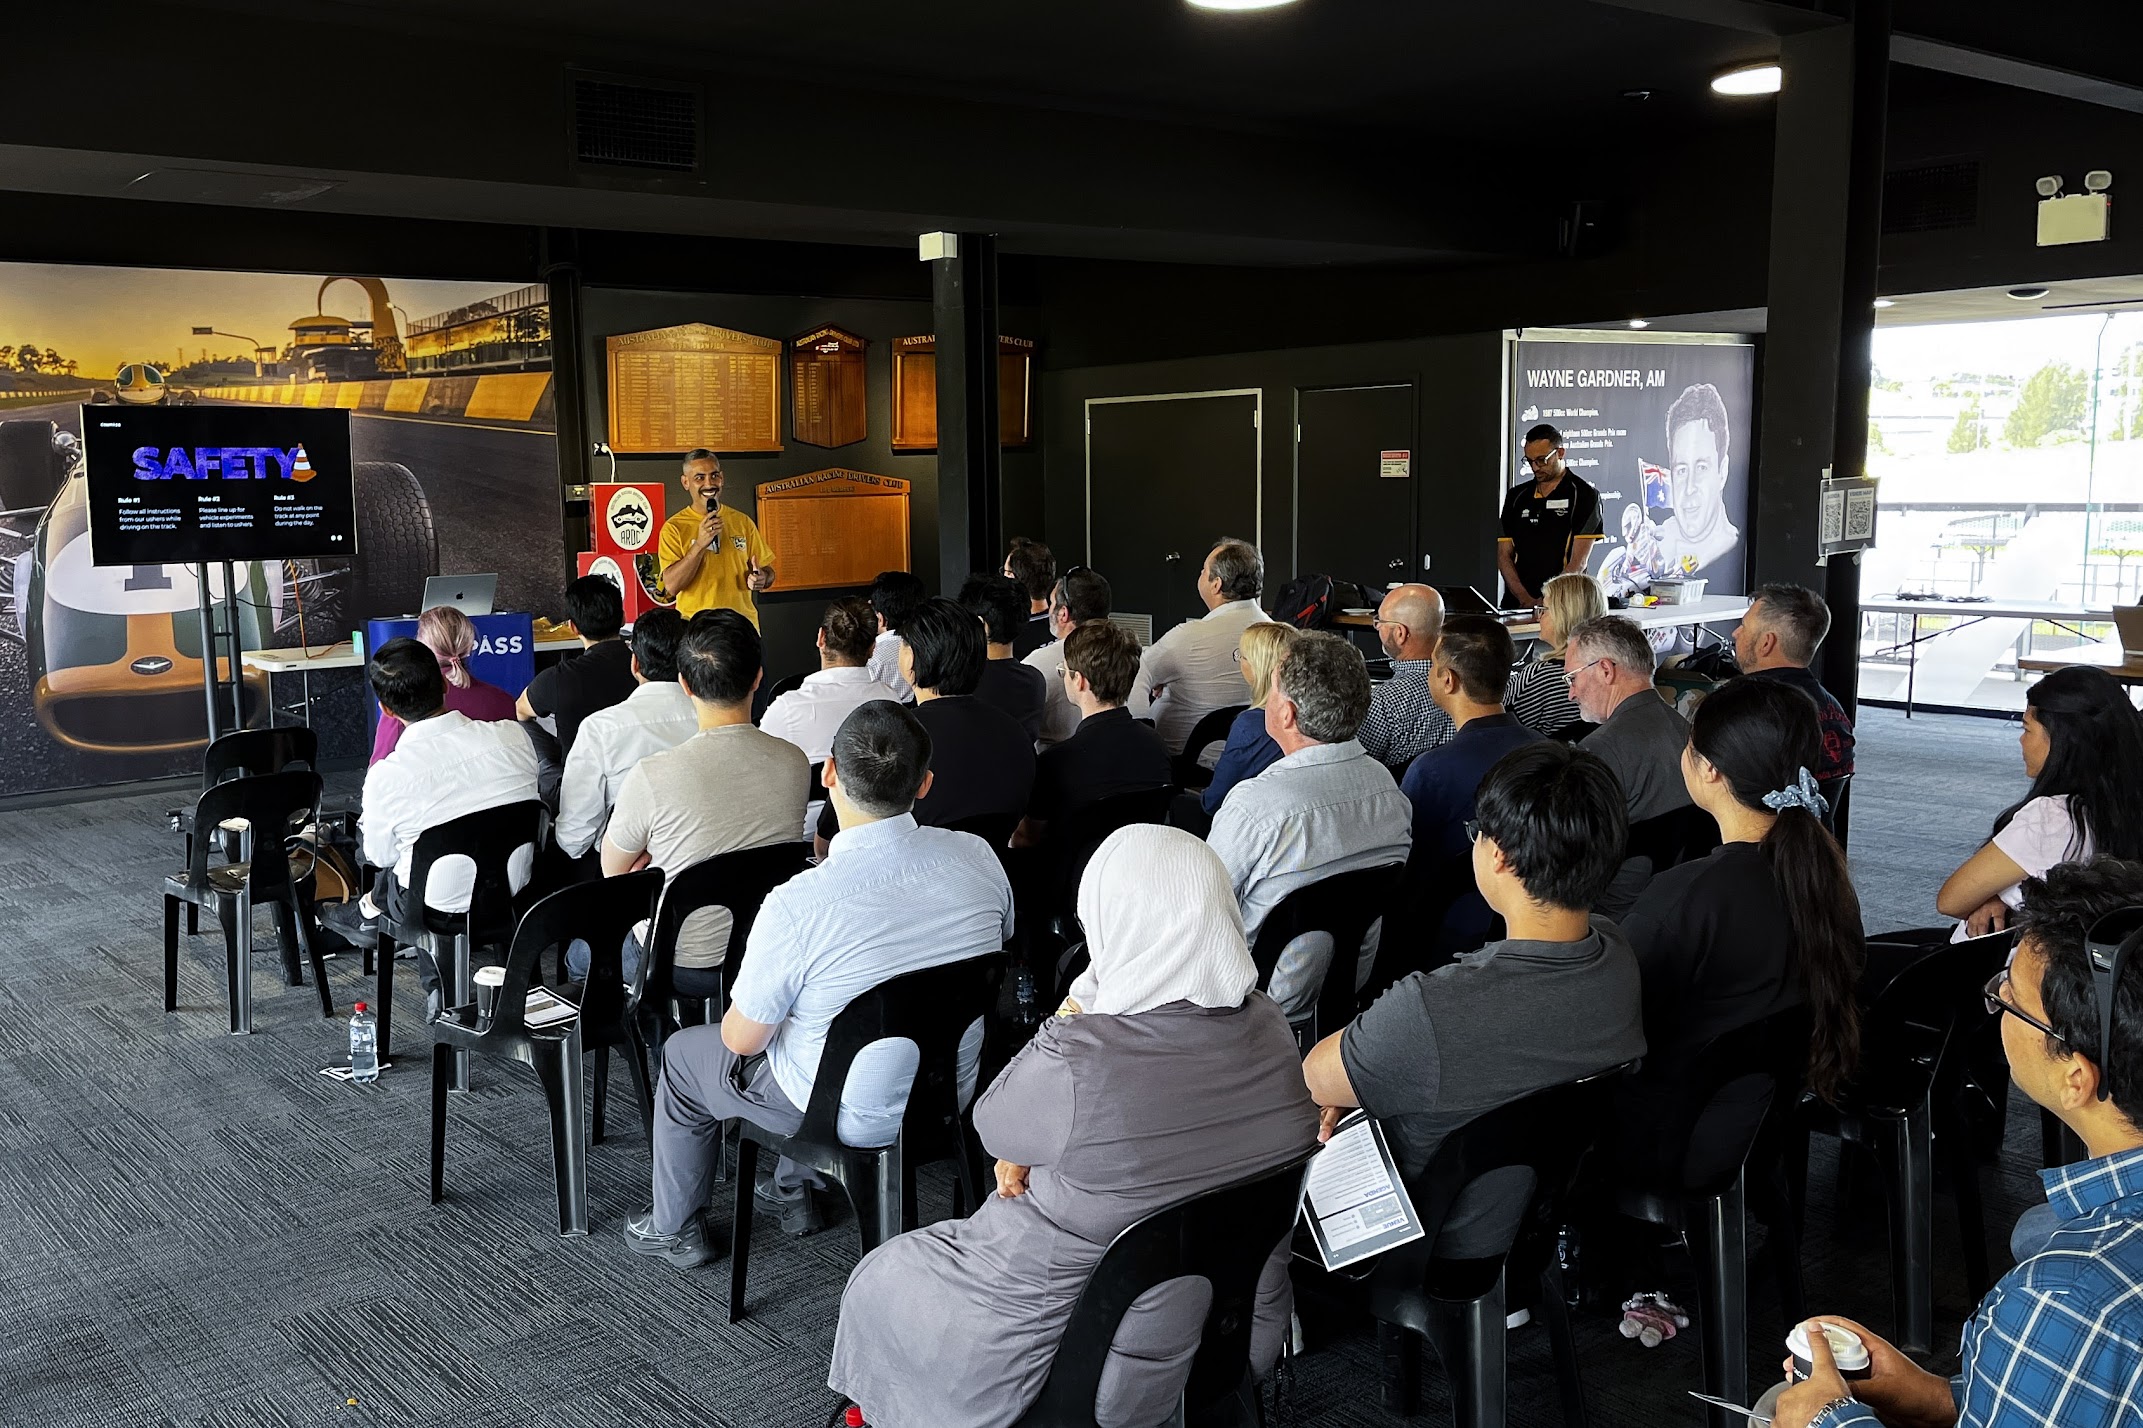
On 2 November 2026, Compass held our annual Track Side Research Day at Sydney Motorsport Park in Eastern Creek. Over 70 transport professionals from more than 15 private and government transport organisations spent the day participating in real-life road safety experiments and listening to presentations on how Compass connected vehicle data is being applied across the country and abroad.
This is the first year we've run two Track Days within twelve months. In September we took the experiments to Richmond Raceway in Virginia — our first in North America — and seven weeks later we're back on home ground at Eastern Creek, running the experiments with two very different sets of drivers.
The event brought together transport leaders from organisations including Transport for NSW, Transurban, NSW Police Force, NRMA, the University of Technology Sydney, Randwick City Council, Shellharbour City Council, Ku-ring-gai Council, Port Macquarie Hastings Council and McLaren Traffic Engineering. Presenters included:
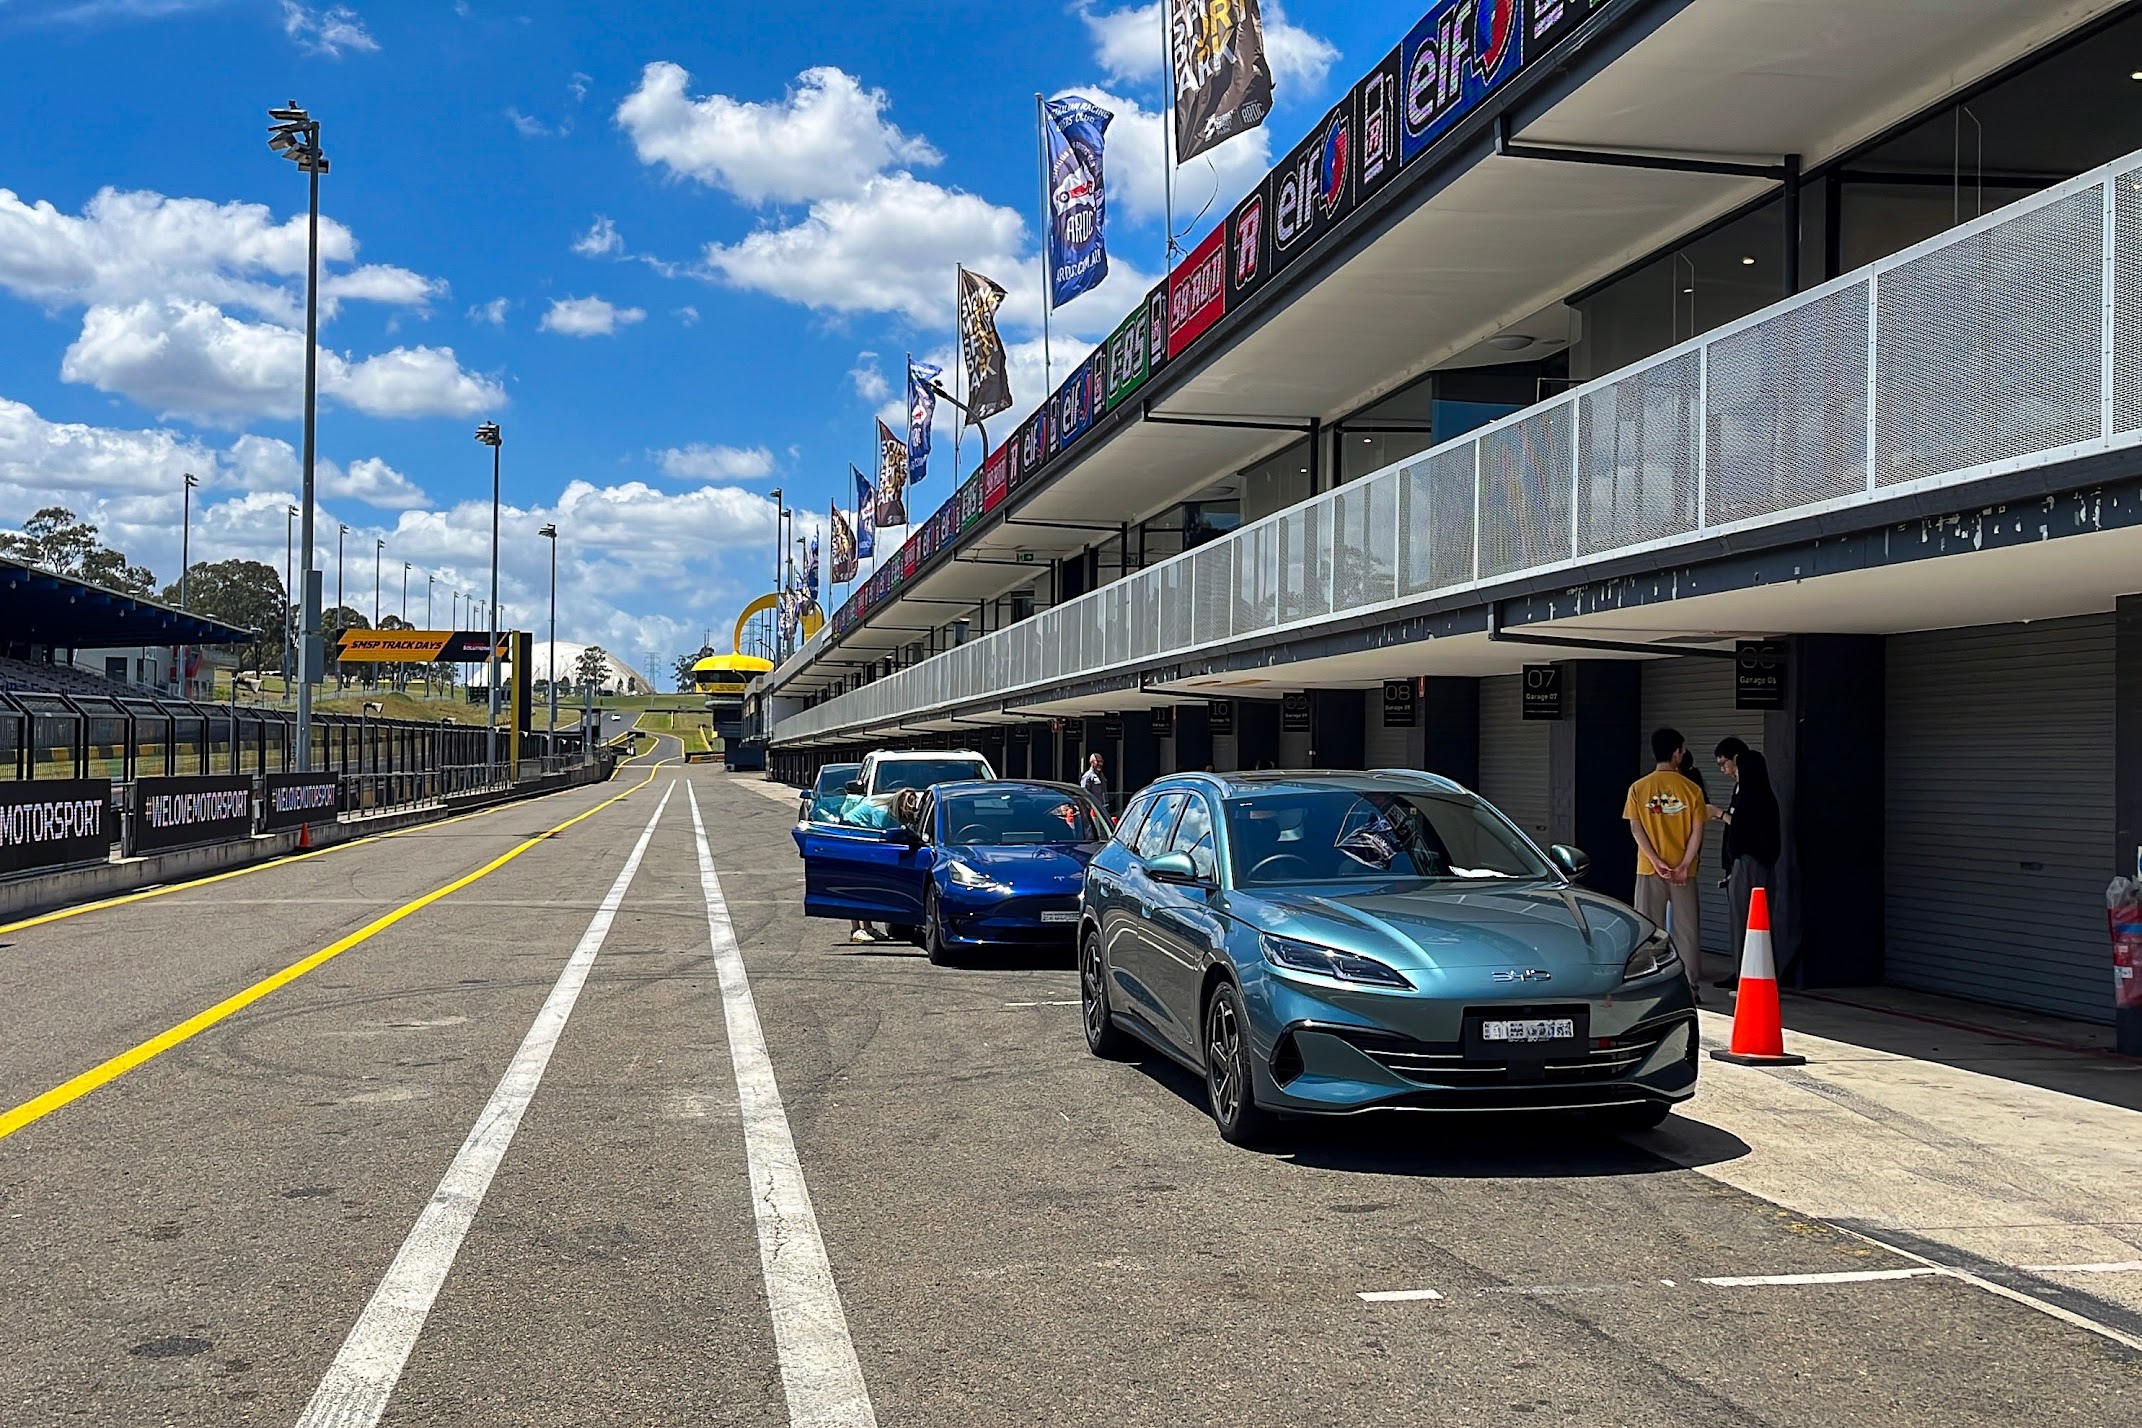
Attendees participated in 4 experiments across the Sydney Motorsport Park circuit, each imitating a section of the road network under different speeding and braking conditions:

Participants received personalised results on their phone covering their overall trip and each experiment. An example of the kinds of data they received is below.

Below are g-force distributionsfor each experiment site. The highest g-forces were recorded at the Sudden Stop experiment.
The highest g-forces were recorded at the Sudden Stop, where drivers averaged a peak of 0.92 g and one participant reached 1.14 g. The Roundabout and Navigating Curves sat lower, averaging 0.53 g and 0.58 g respectively, though the hardest single readings at those sites still reached 0.97 g and 0.86 g.
Noting that the accepted ‘safe’ threshold for g-forces in most on-road situations is 0.47, that 1.14 g peak is approximately 2.4 times the threshold — and average peak g-forces exceeded the threshold at all three sites.
After each experiment we asked drivers to estimate the g-force they had just produced, then showed them what their vehicle actually recorded. The results split in an unexpected way.
Taken as a crowd, the room was remarkably accurate: the group's average estimate landed within 0.1 g of the recorded figure at every experiment. Taken individually, that accuracy disappears. The spread between drivers was wide, and the typical driver guessed lower than the number their vehicle reported — the average was only right because the over- and under-estimates cancelled each other out.
Accuracy tracked the severity of the movement. The harsher the manoeuvre, the better the guess. Drivers read the Sudden Stop best, with a median estimate within 20% of the recorded g-force, and the Roundabout worst, where the median estimate was out by roughly 53%. The gentler forces of a roundabout are, it seems, the easiest to dismiss as nothing much.
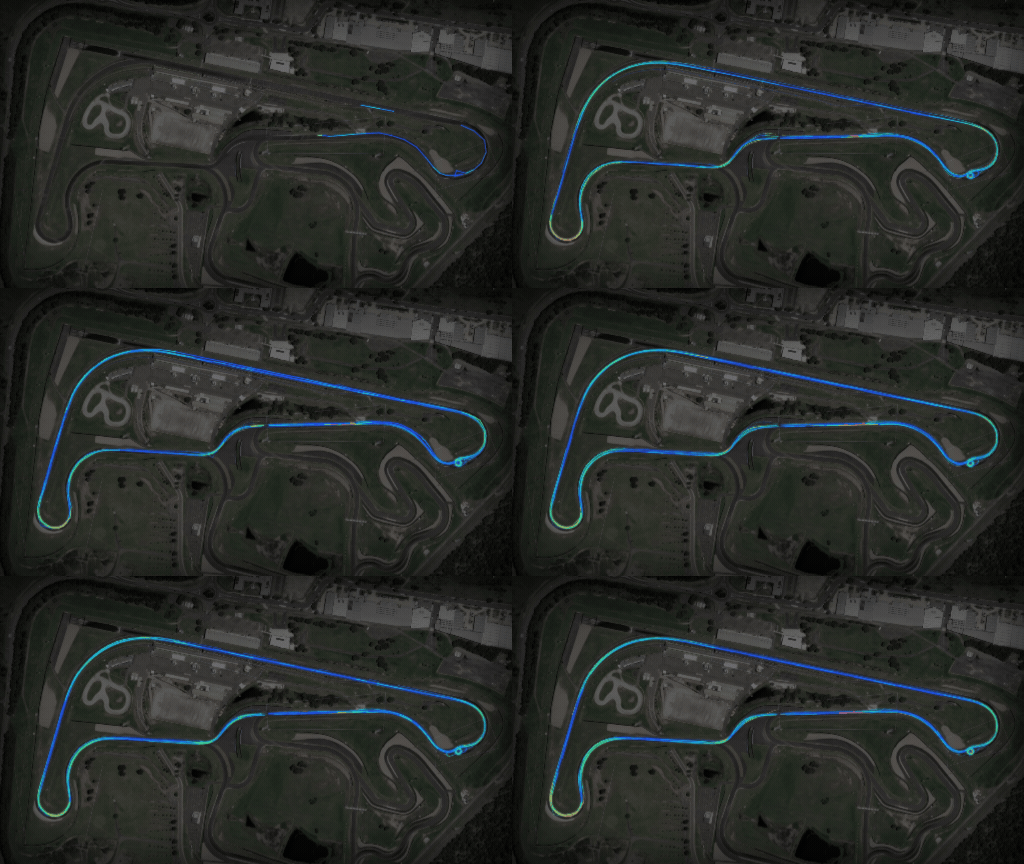
Below are the trip traces collected from vehicles as they went around the track.
If you found this article interesting, you might want to check these ones out.


If you found this post interesting, you might also want to check out these.